# Dashboard
# Introduction
Dashboard, often referred to as Web Dashboard, is the primary starting point from with other Quantum web applications are launched.
# Launch The App
The app can be accessed in your browser by entering the Dashboard URL in your browser’s address bar.
TIP
Dashboard URL https://www.qscorpio.com:3066/Dashboard/
# Create Desktop Shortcut
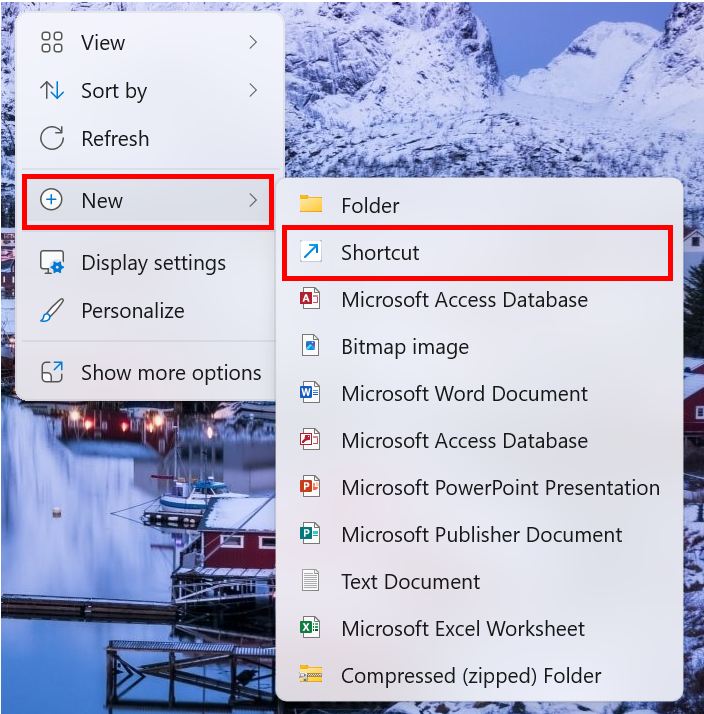
To create a Desktop Shortcut, first right-click on any open space on the desktop. Then choose ‘New’ and then ‘Shortcut’.
In the field provided, enter the full URL of Web Dashboard.
If you wish to restrict users to a specific dashboard, be sure to include the name of the dashboard at the end of the URL.
Example URL that would restrict users to the “Cardinal Home” dashboard: https://www.qscorpio.com:3066/Dashboard/?dashboard=Cardinal Home
More information can be found here.
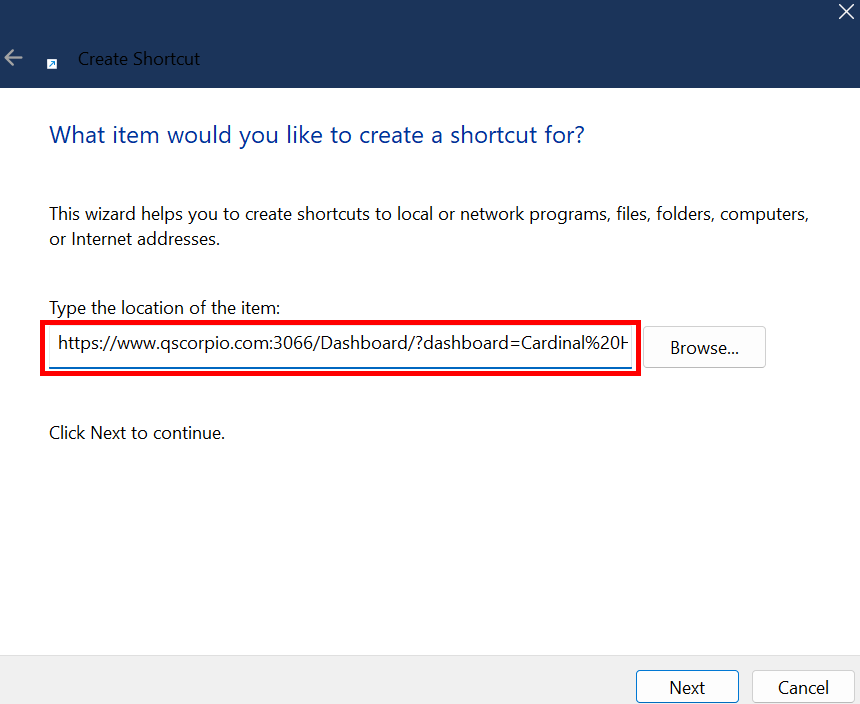
Once the desired URL has been entered, click ‘Next’.
Give the shortcut a name then click ‘Next’.
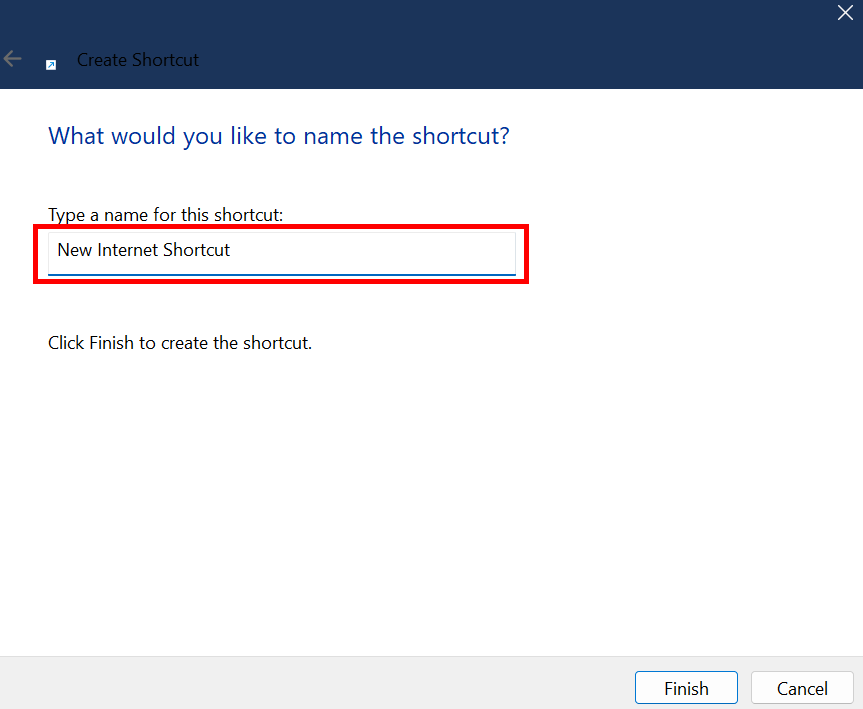
The shortcut will then appear on the user’s desktop.
If the Quantum thick client is installed on the machine, the following steps will allow the icon of the shortcut to be changed to Quantum’s logo.
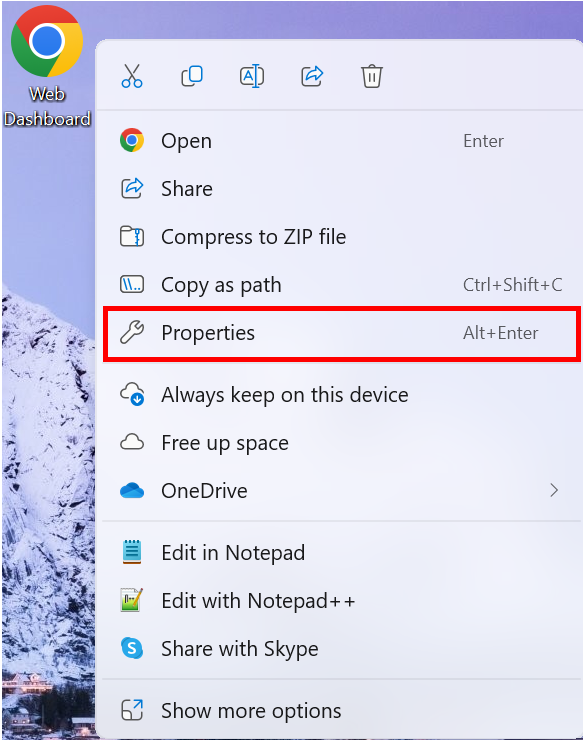
Right-click on the shortcut then select ‘Properties’.
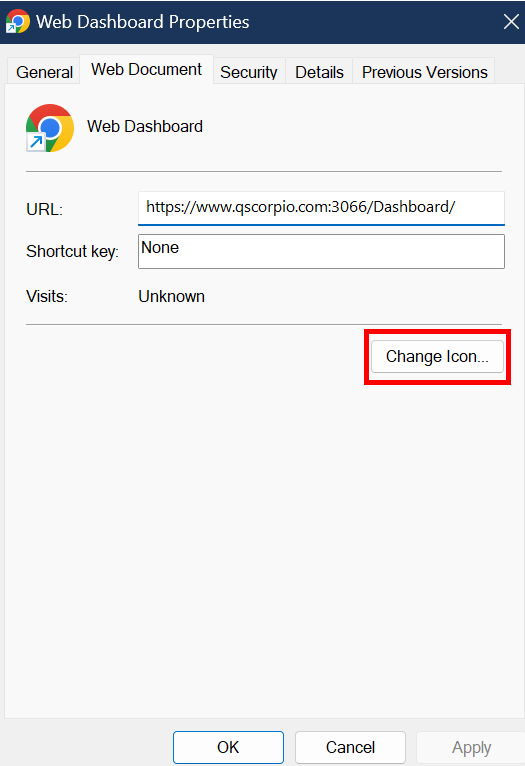
Select ‘Change Icon…’ under the ‘Web Document’ tab.
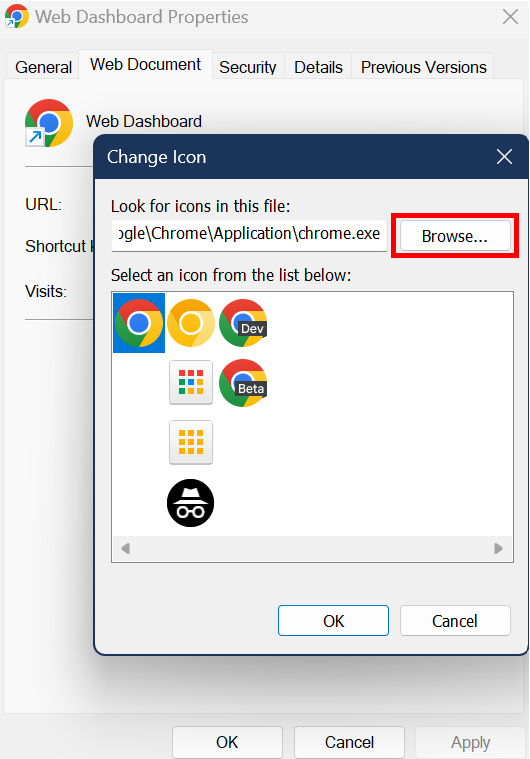
Use the ‘Browse…’ button to navigate to the C:\CASPer directory and find Q.exe then click ‘Open’.

Select the Quantum “swoosh” logo and click ‘OK’. Then click ‘OK’ on the Properties window to save your changes.
# Logon
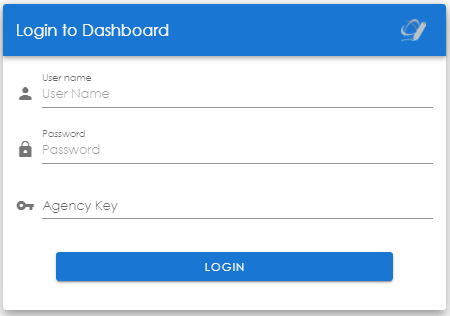
The Login screen will be presented when you first launch the web app. The user will insert their Username, Password, and Agency Key assigned to them by their Admin.
# Select a Dashboard
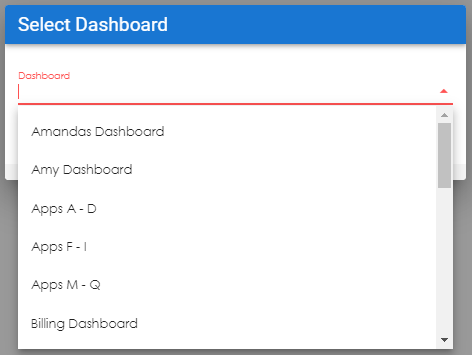
After logging in, the user’s default dashboard will automatically be selected for them. If the user has no default dashboard, a dashboard must be selected before continuing. Dashboards can be changed under the user’s avatar.
# Pass Dashboard as URL Parameter
TIP
Optionally, the dashboard can be passed in as a URL parameter. If it is passed in, that dashboard will be automatically picked up and the user will not have to select one.
PARAMETER EXAMPLE: dashboard=MyDashboard
URL EXAMPLE: https://www.qscorpio.com:3066/Dashboard?dashboard=MyDashboard
# Home Screen

This is the Dashboard Home Screen. It will act a lot like the home screen on a phone or tablet. Each button on the dashboard acts like an app icon would on a phone. When the user clicks a button on the dashboard it will open the corresponding web app or whatever the user has paired with the button.
The Dashboards consist of three main sections: the Left Side Panel, the Main Button Panel, and the Indicator Panel. The Left Side Panel and Main Button Panel are just like in the Thick Client Dashboard. All configured buttons on the Thick Client which have corresponding web apps will be displayed. Buttons for non-supported web applications will not be displayed. All indicators from the Thick Client are now displayed in the Indicator Panel at the top.
# Selecting a Client
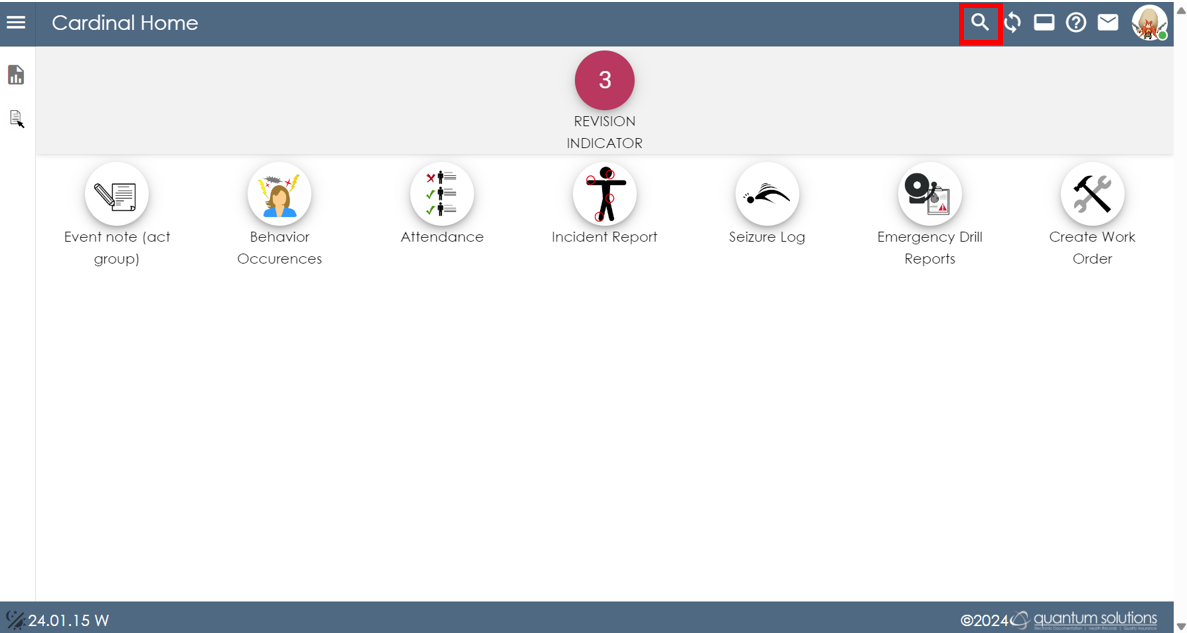
Click the magnifying glass icon  to search for a client.
# Client Required
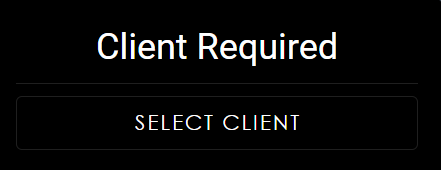
If a button is configured as “Client Required” you will receive the above message and be prompted to pick up a client if one has not already been selected. Clicking ‘Select Client’ will direct the user to the client search function where they can begin typing to search for a client.
# Refresh Dashboard Indicators
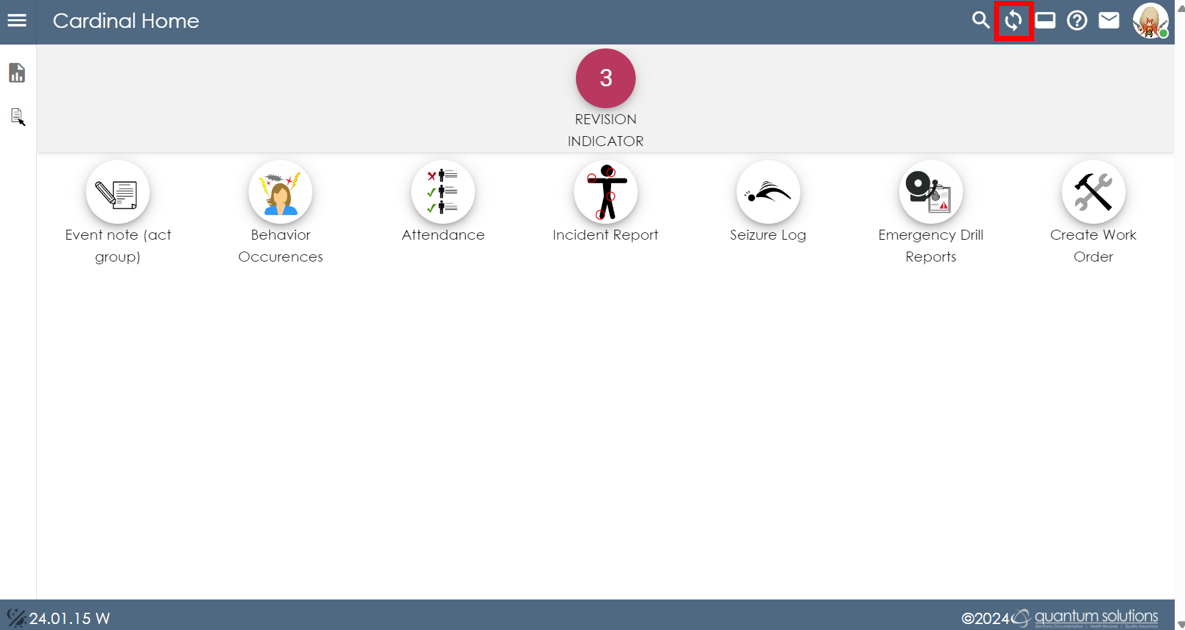
If the dashboard has any indicators, clicking this  button will refresh those indicators and update the number shown if applicable.
# Hide/Show Dashboard Indicators
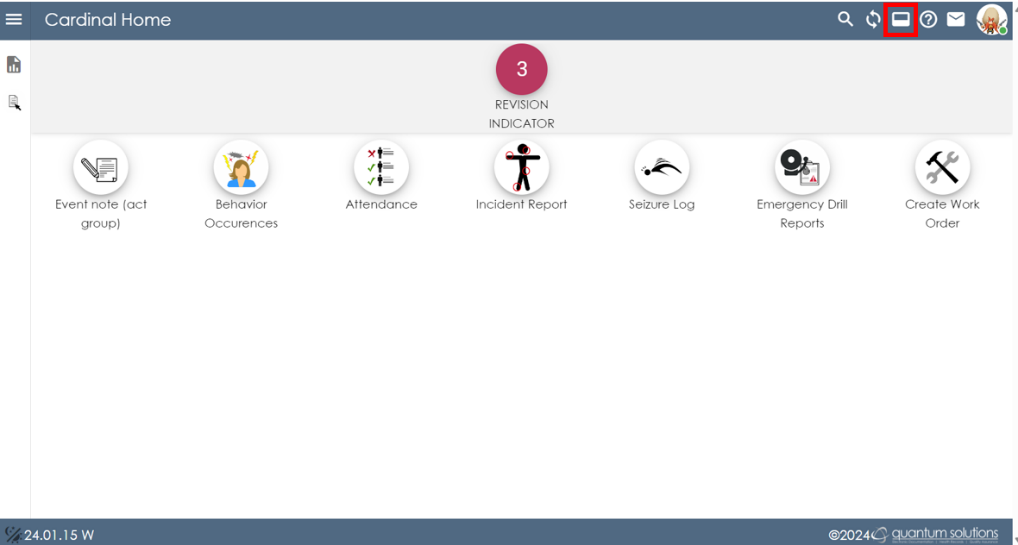
Clicking the  hide/show Dashboard Indicators button will collapse or show the panel where the indicators are shown.
# User Guide
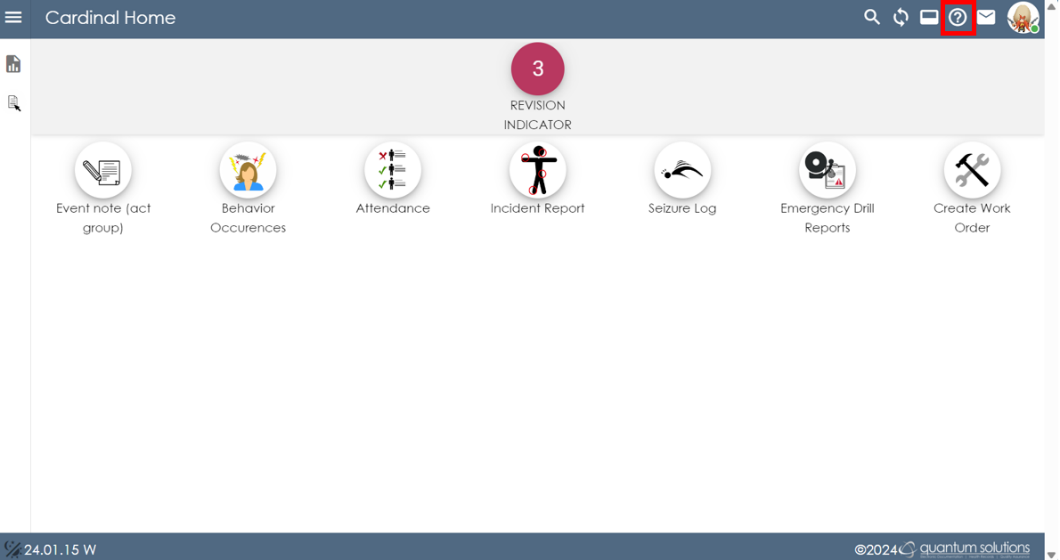
Clicking the  “?” button will open the online user guide in a new browser tab.
# QMunicate
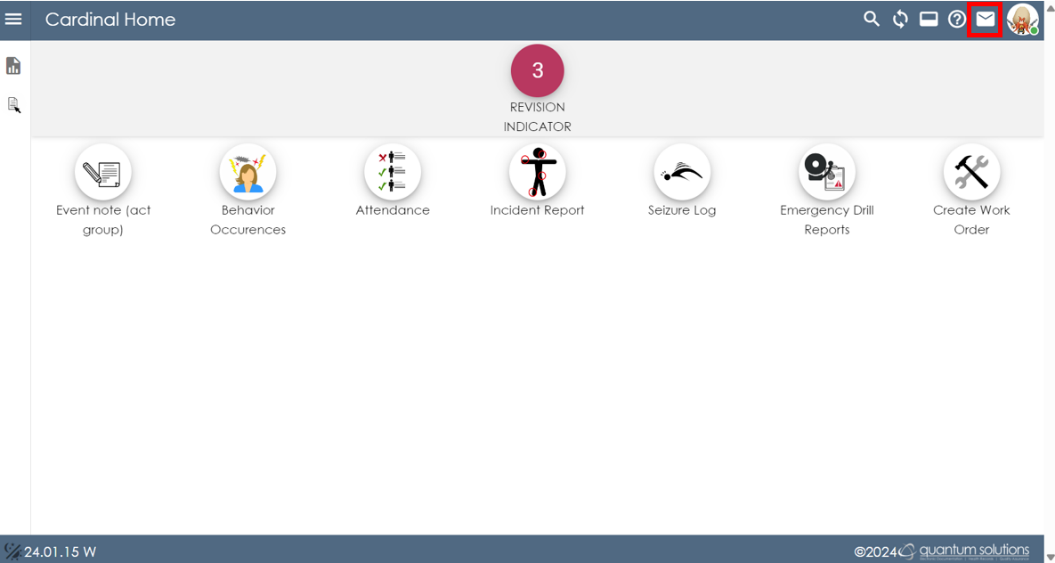
Clicking the  envelope icon will open the QMunicate web application in a new browser tab.
Note
If the user has messages that are required to be read, the user will be forced to open QMunicate and read those messages before the dashboard can be used.
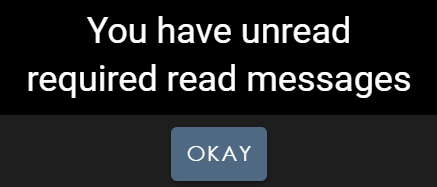
If this message is still there after all required messages have been read, clicking “Okay” will clear the message and allow the dashboard to be accessed.
# User Avatar
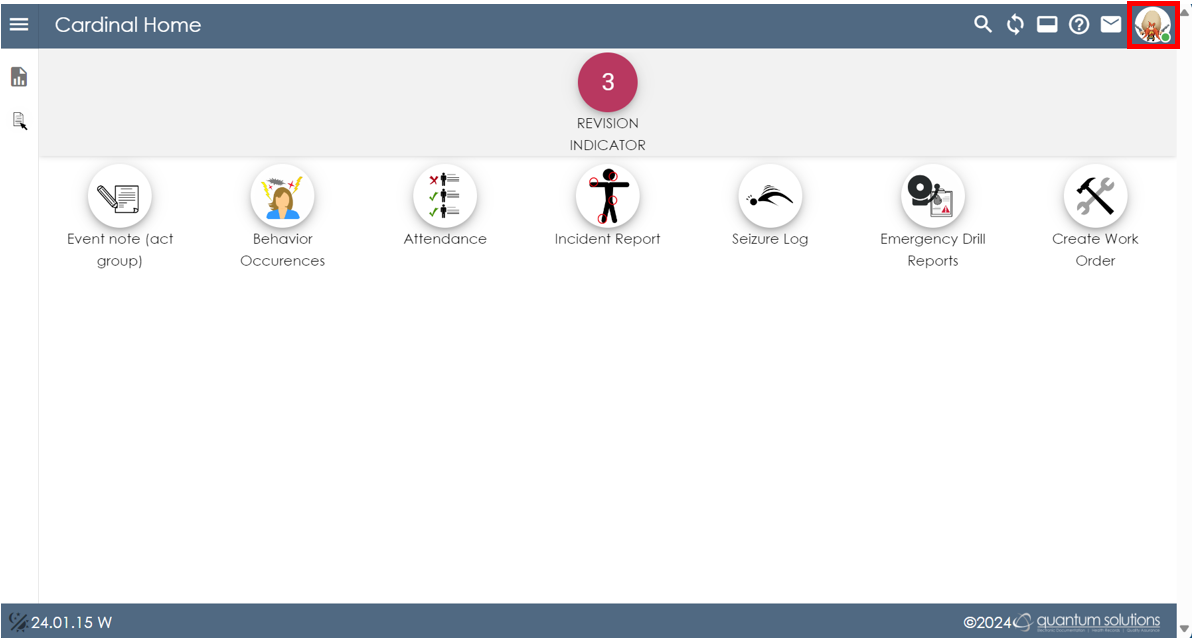
The user’s avatar icon will either show their staff image or their initials.
Clicking this button will display additional options.
# Changing Dashboards
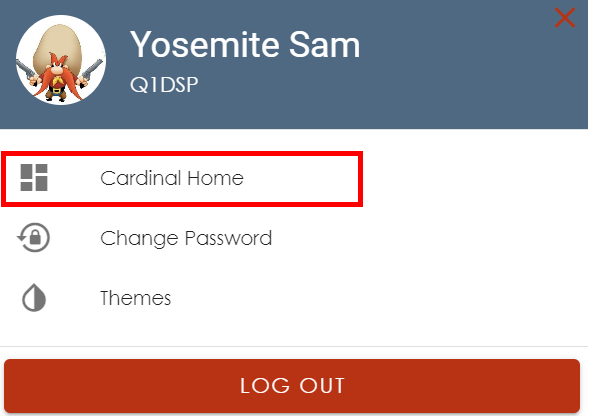
The first option within the user avatar is the ability to change dashboards. Clicking this option will allow the user to type to search for a dashboard or just select from the options available.
::: Note
This option will be disabled if a dashboard parameter exists in the URL.
:::
# Changing Password
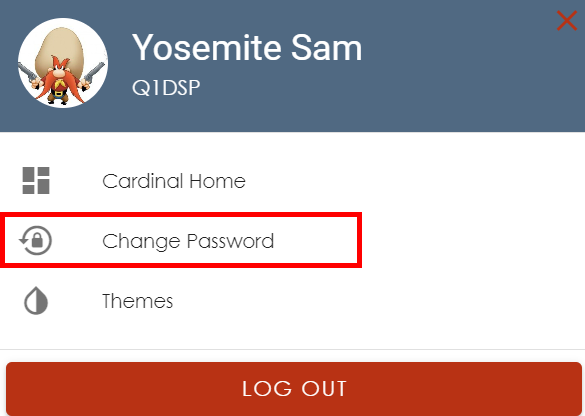
Clicking ‘Change Password’ will allow the user to change their password.
# Themes
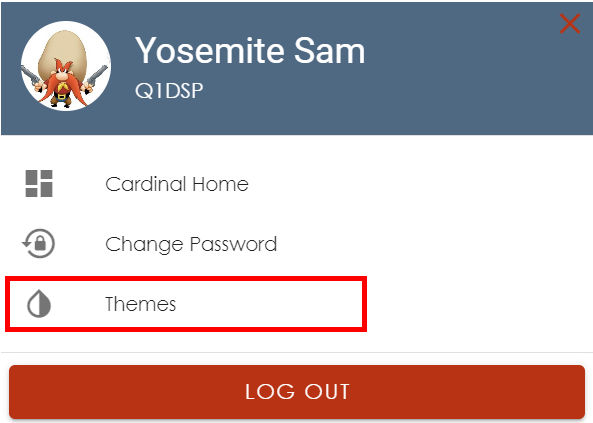
Clicking ‘Themes’ will allow the user to change the color of some elements of the Quantum web applications.
Logout

Clicking ‘Log out’ will log the user out of web dashboard and any other Quantum web applications that are open in any additional browser tabs.
# Exiting the User Avatar Options
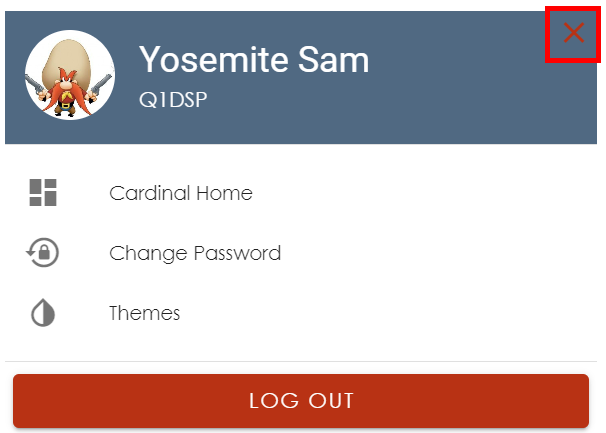
Click the “X” in the top right-corner of the user avatar panel to close it.
# Left Side Panel
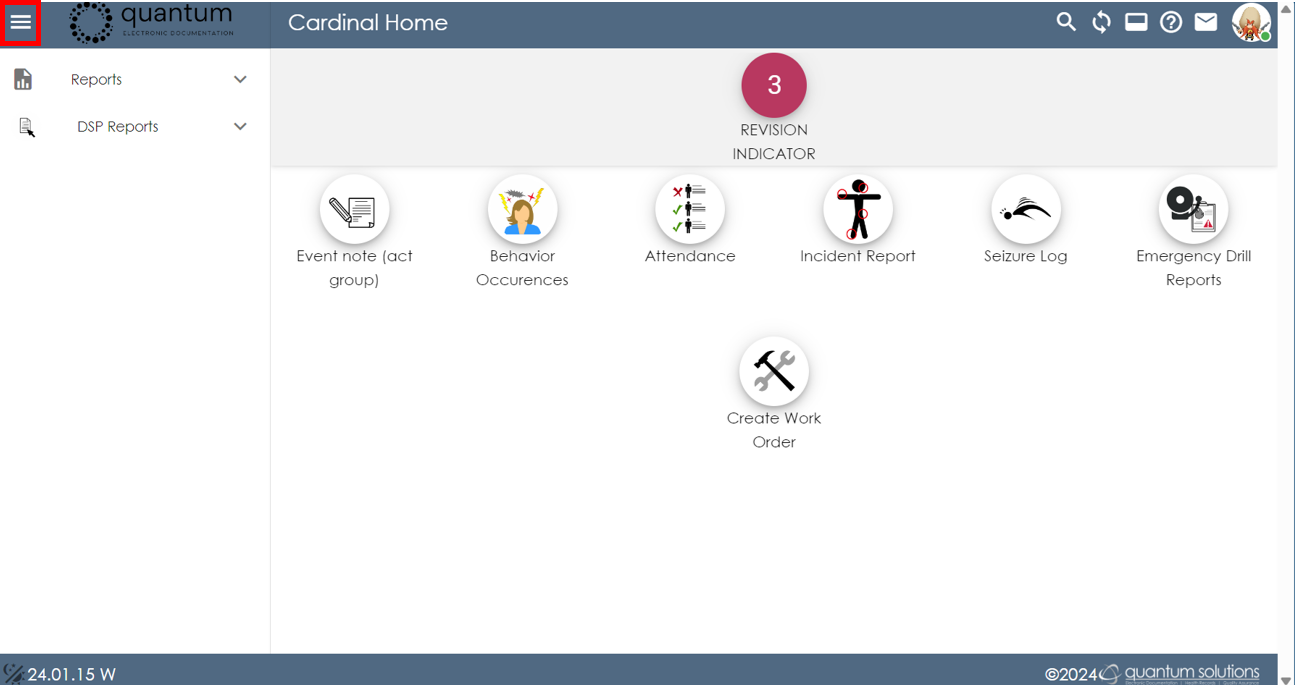
The left side panel will contain all reports available on the selected dashboard. This panel can be opened and closed using the icon with three horizontal bars stacked vertically  .
.
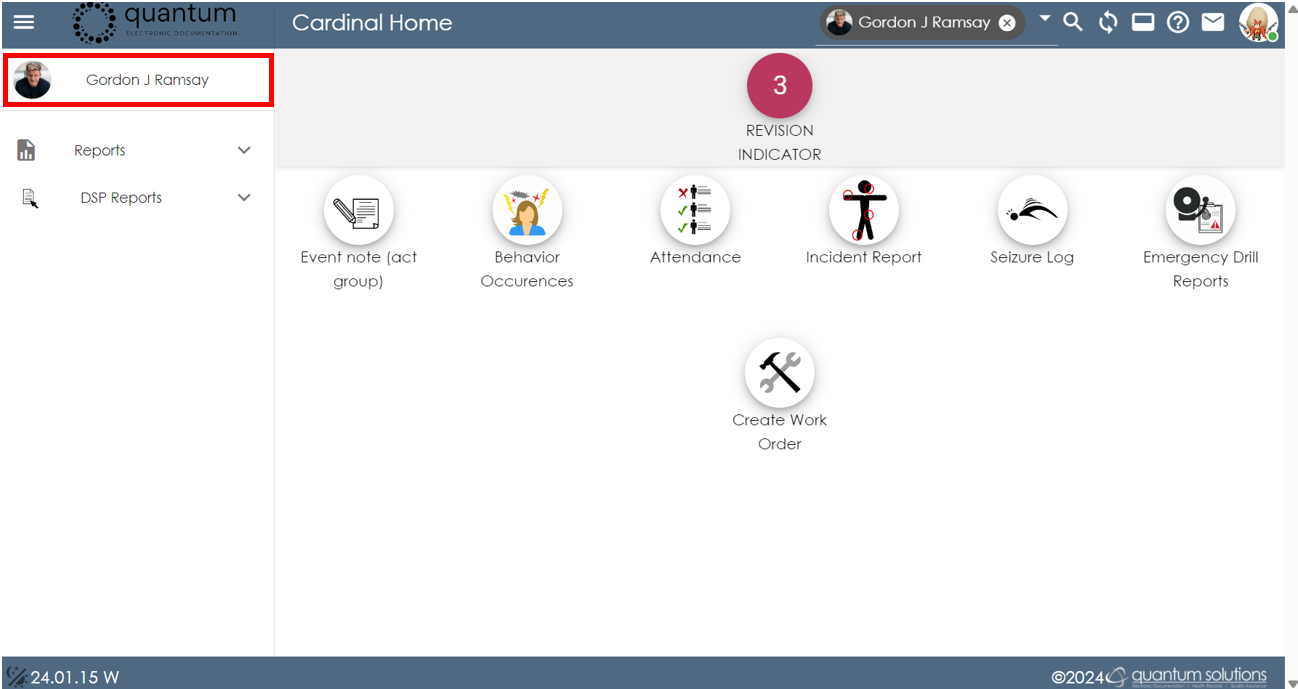
If a client has been selected, a client card with some client-specific information will also be displayed here.
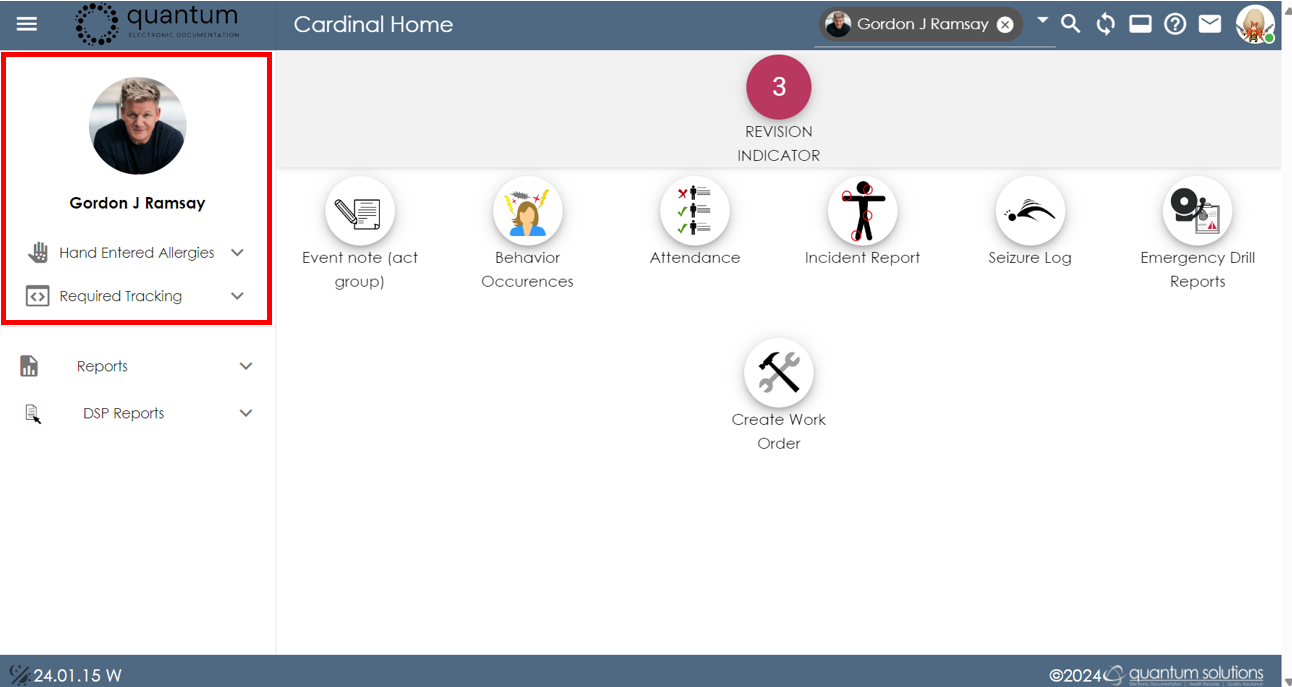
This card can be expanded or collapsed by clicking on the client’s picture.
# Light/Dark Mode
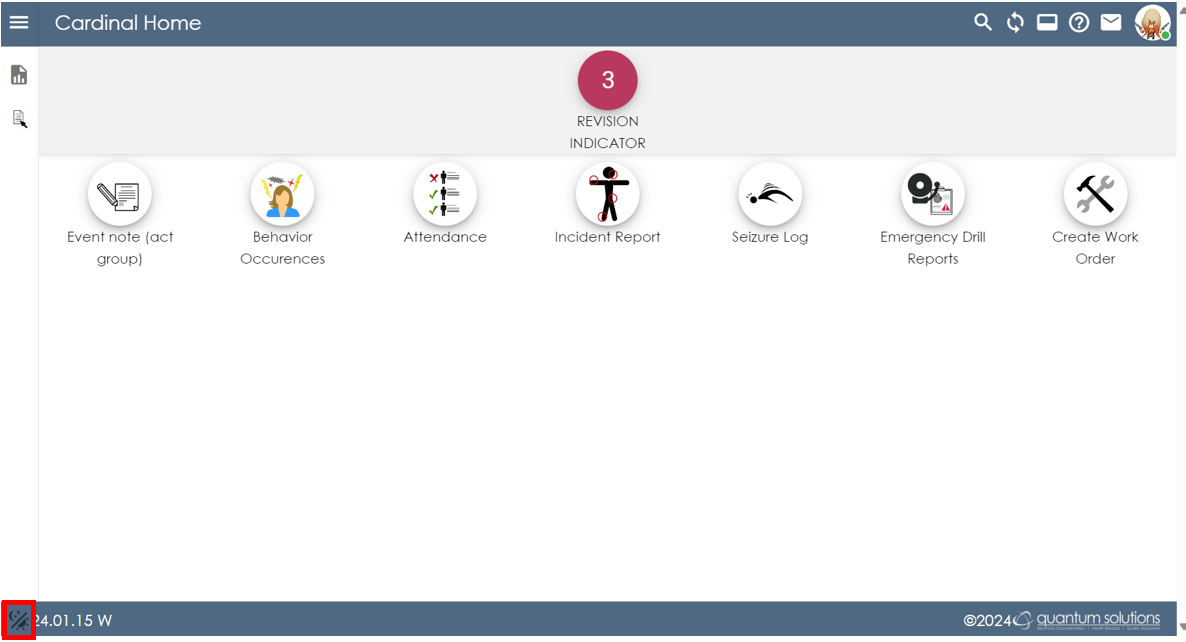
Clicking the  “Light/Dark Mode" button on the bottom left corner of the page will toggle between Light Mode and Dark Mode.
Last Updated: 2/19/2024
# Change Log
Version 25.03.31 W
Version 25.03.25 W
Version 25.01.27 W
Version 25.01.16 W
Version 24.11.01 W
Version 24.04.18 W
Version 24.04.17 W
Version 24.03.20 W
← Contacts Demographics →