# TPADD
# Introduction
Transition Program Assessment Diagnosis Detail web application is used in conjunction with the transitional housing grant program.
# Launch the App
The app can be accessed in your browser by entering the TPADD URL in your browser’s address bar.
TIP
TPADD URL https://www.qscorpio.com:3066/TPADD/
# Log In
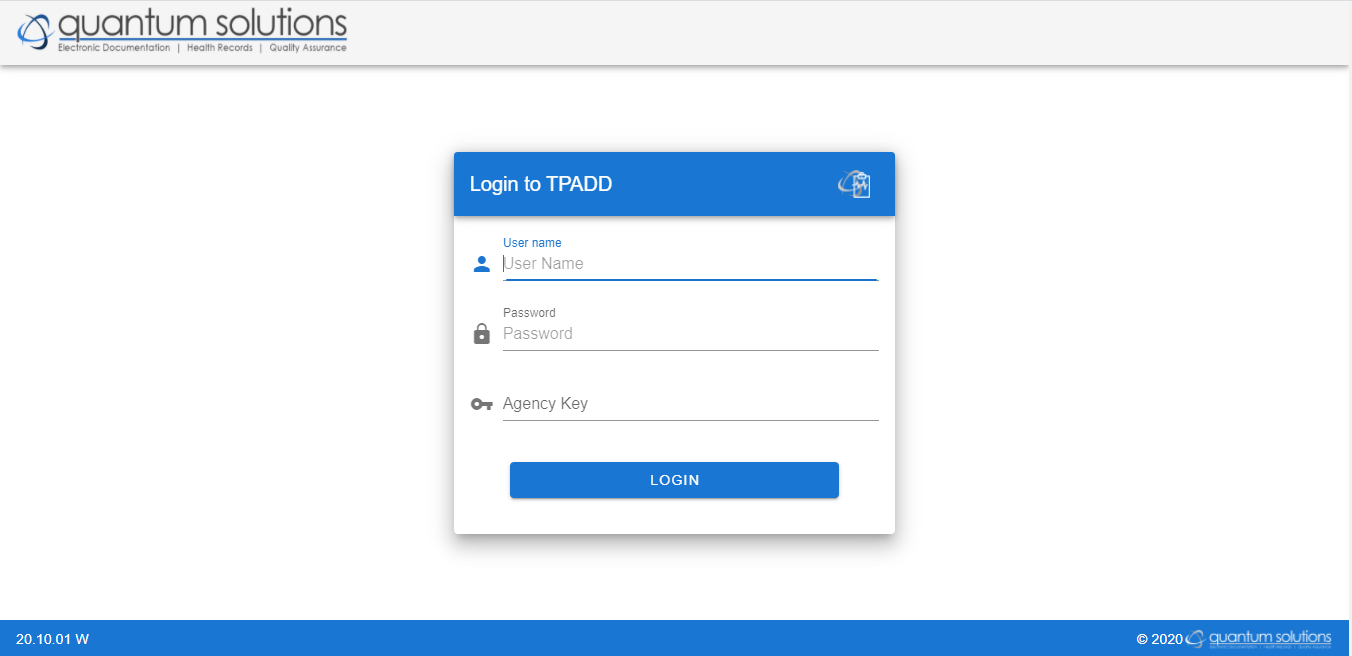
The Login screen will be presented when you first launch the web app. The user will insert their User Name, Password, and Agency Key assigned to them by their Admin.
# Home
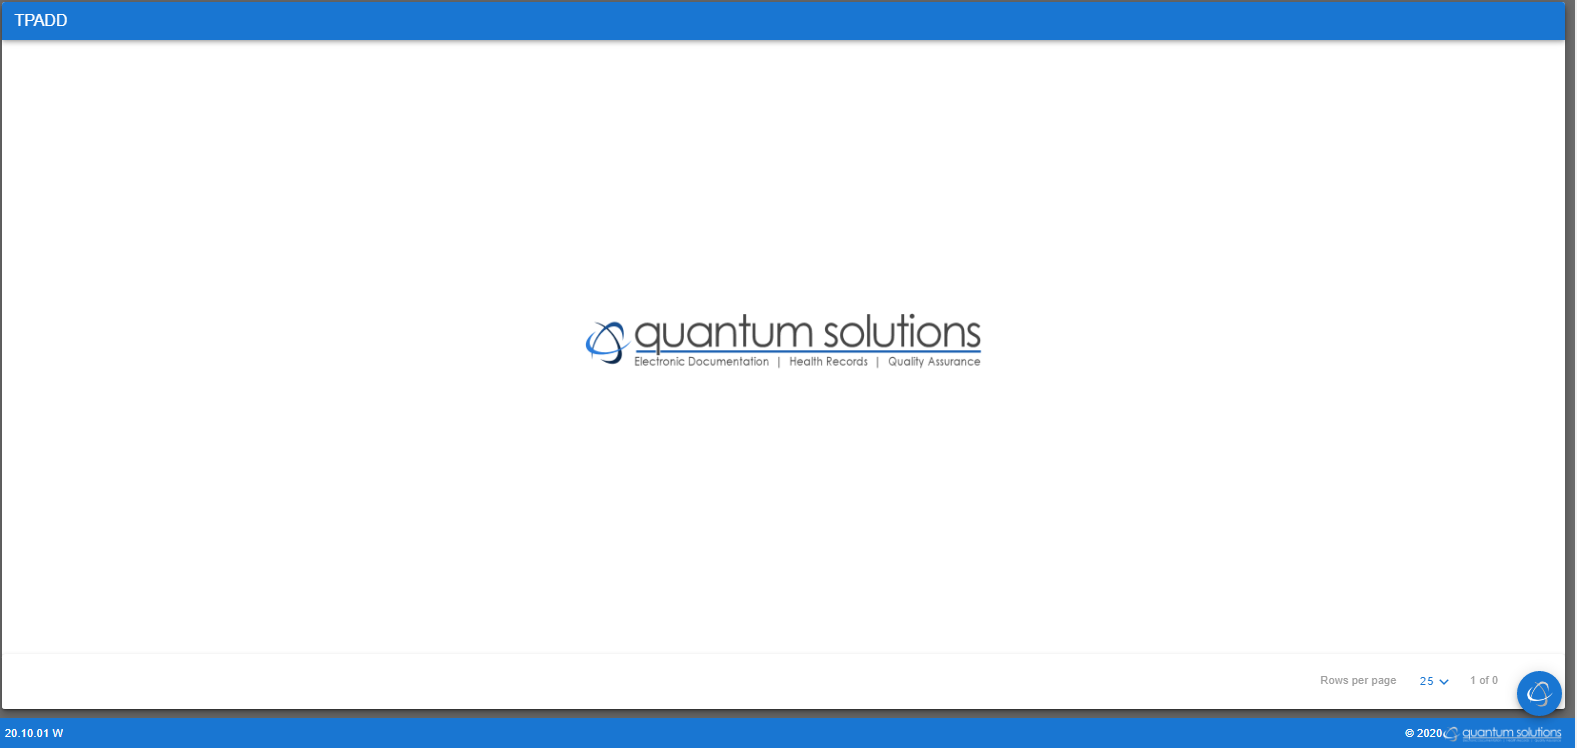
The home screen will show the user’s company logo. Initially, this screen will be blank. To begin, first click the Blue Circle Menu to select a client and begin entering diagnosis
# Menu
# Blue Circle Menu
When a user selects the Menu button located in the bottom right-hand corner, a list of functions will be brought up.


The functions from top to bottom are Logout, User Guide, Select Dashboard Light/Dark mode, Select Client, and Close Menu.
# Logout

When a user selects the Logout button, it will log the user out and take them back to the Login screen. Any information not saved on the Client Diagnosis screen will not be saved.
# User Guide

This is where the user will access the User Guide while logged in on the website
# Select Dashboard

This is where the user can select a dashboard to which they have access to.

A drop down menu will show an alphabetical list of all the dashboards the user has access to. The user can type in the search bar to search for the dashboard or use the scroll bar on the right. When the right dashboard is found, it will reload the screen to have that dashboard running, so then the user can click the Blue Circle Menu and Select a Client that is in the selected dashboard.
TIP
Optionally, the dashboard can be passed in as a URL parameter. If it is passed in, that dashboard will be automatically picked up and the user will not have to select one.
PARAMETER EXAMPLE: dashboard=MyDashboard
URL EXAMPLE: https://www.qscorpio.com:3066/TPADD?dashboard=MyDashboard
# Light/Dark Mode

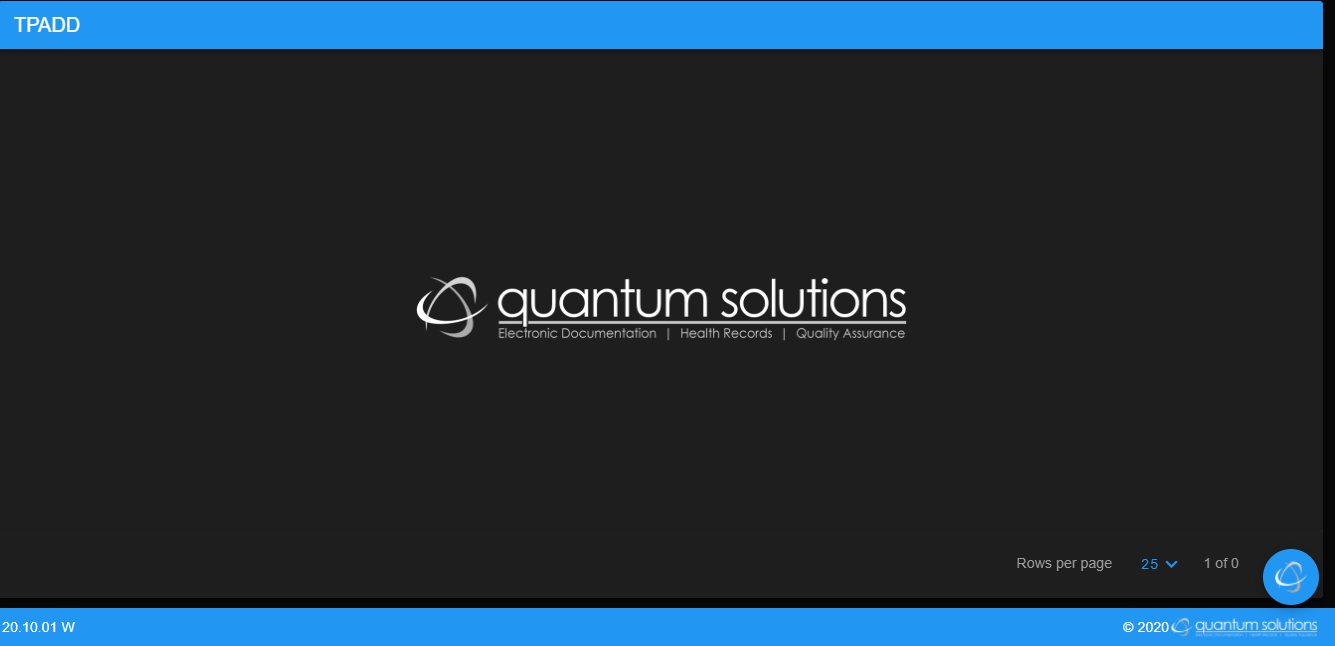
This function will toggle between light and dark mode.
# Select Client

The Select Client button loads the Client Selector.
# Client Selector
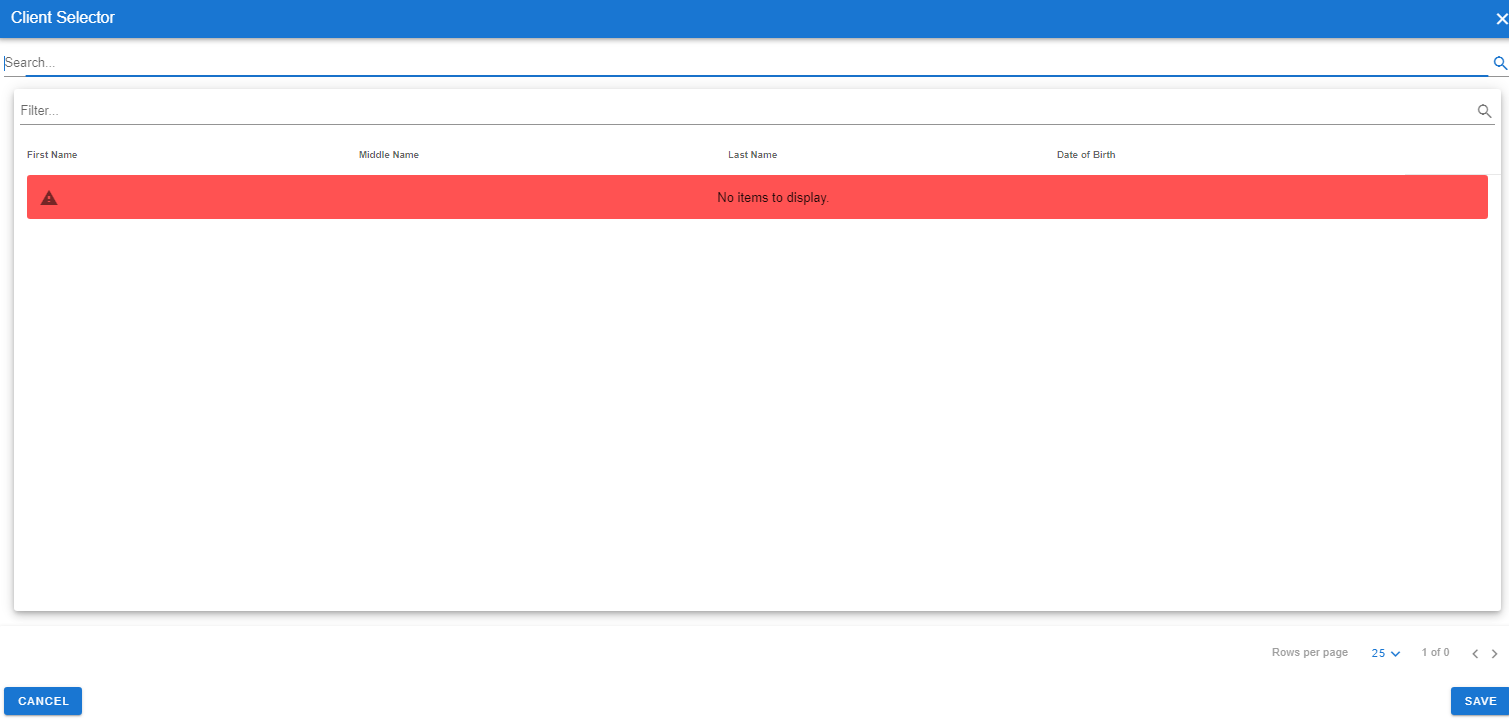
The Client Selector allows you to search the clients to which you have access. To search for a client, click the top search bar and type any portion of the clients first or last name, or both.
TIP
Searching “do do” would return Doug Douglas.
The second search bar is a filter search bar, that allows the user to filter the results of initial client search.
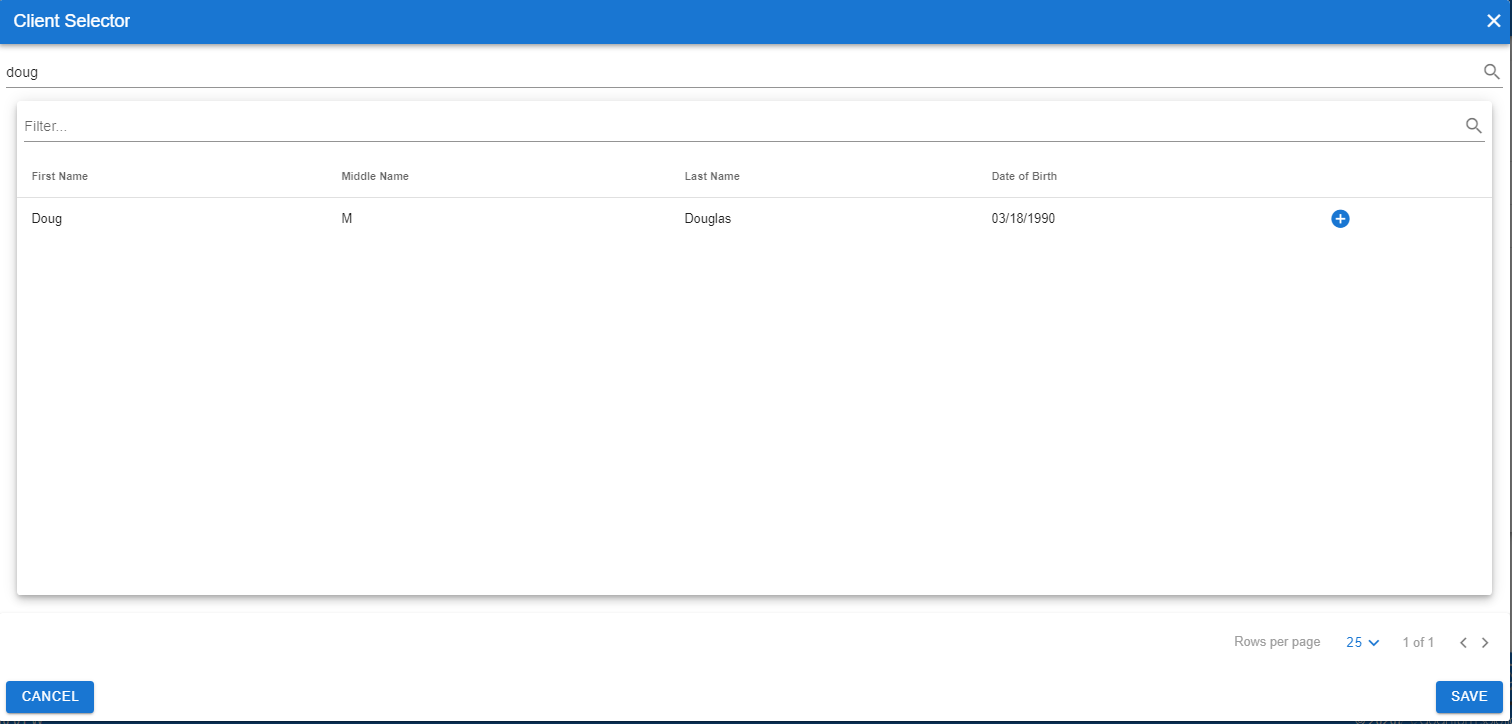
After the user has searched for a client, a list of all possible matches will appear under the filter search bar. Click the plus sign (+) in the blue circle to the right of the client’s name to pick up that client and see a list of their diagnoses
# Client Diagnosis
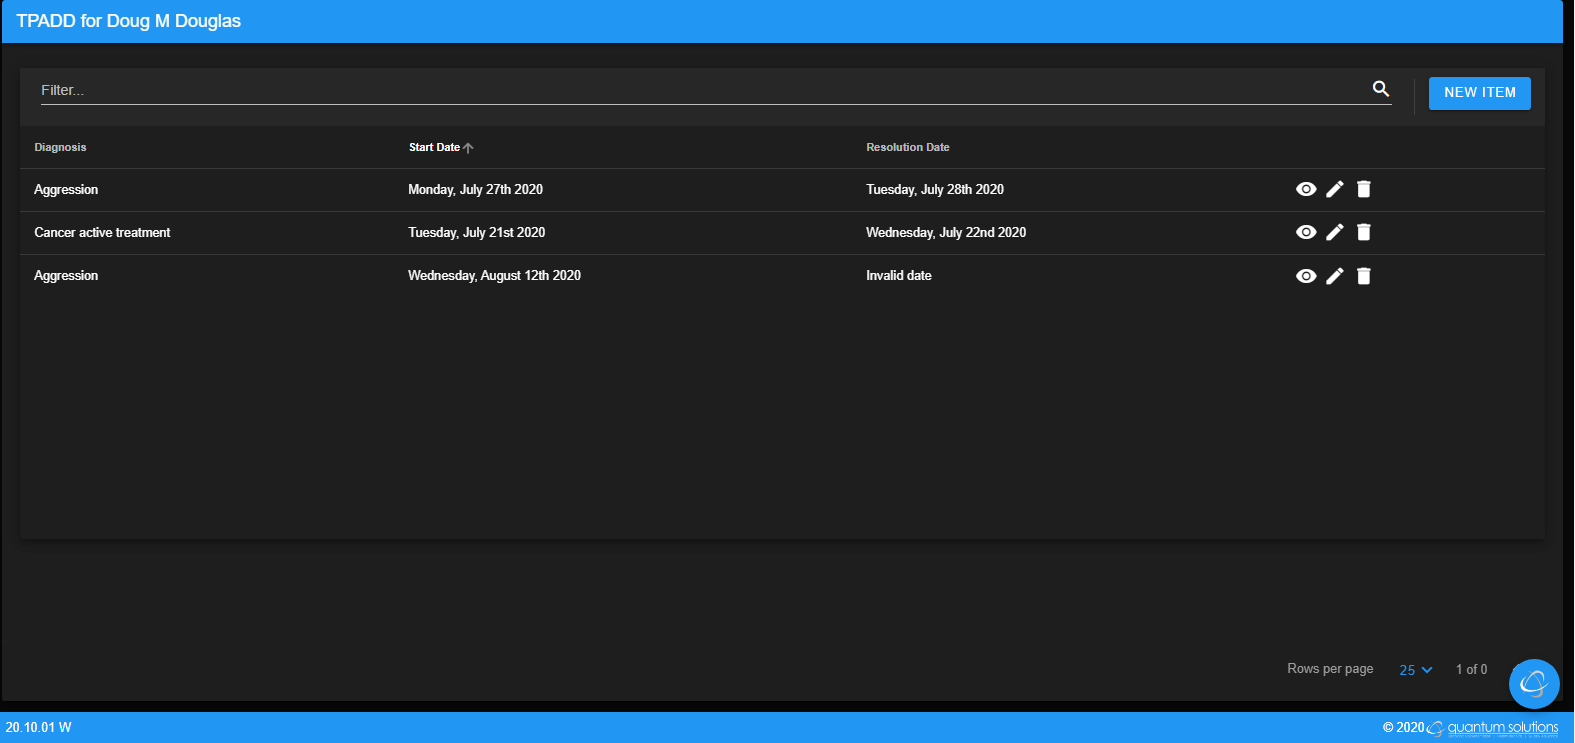
On this page, the user can see all the diagnoses that a staff person has added. The user has the option to View, Edit, Delete and Add a diagnosis. To pick up a new client, the user must go back to the Client Selector Screen by clicking the Blue Circle Menu and selecting the Select Client button
# Functions

# View

The View function allows the user to view more information about the diagnosis, but not change any information.
# Edit

The Edit function allows the user to view and edit the diagnosis information.
# Delete

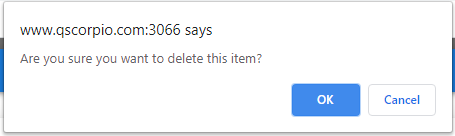
The Delete function allows the user to delete any diagnoses on the client’s diagnosis list.
Warning
Once the user deletes a diagnosis there is no way to retrieve it.
# Add New Diagnosis

To add a new diagnosis, simply click the New Item button located in the top right hand corner on the Client Diagnosis Page
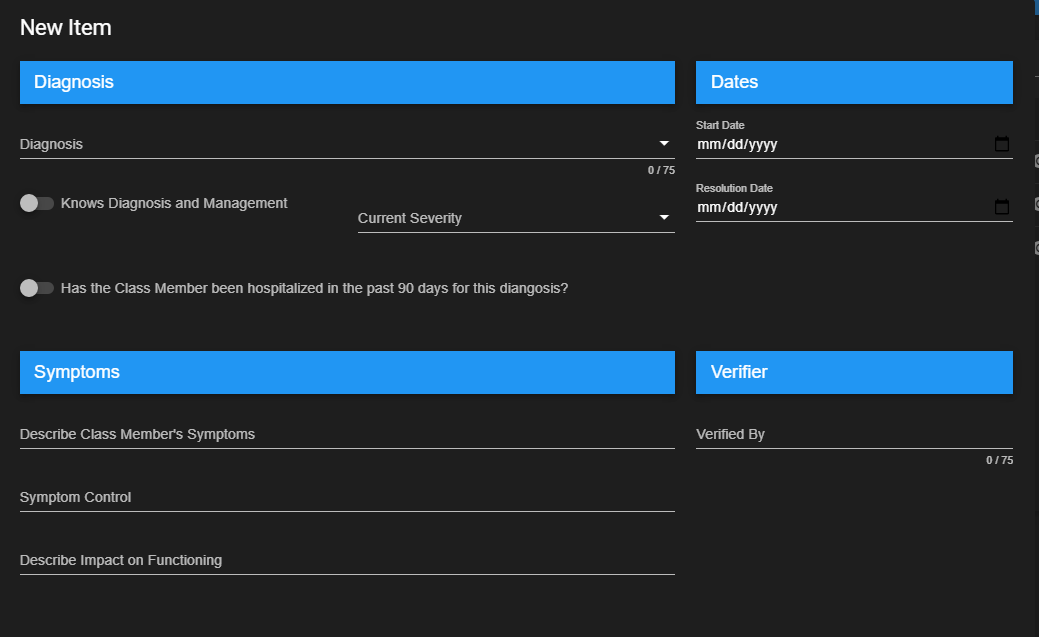
When the user selects ‘New Item’, a New Diagnosis sheet will appear. Select a diagnosis from the preconfigured list of diagnoses under the Diagnosis bar. The user cannot type a new diagnosis if it is not already on the list, but the user can search for a diagnosis that is already on the list by typing in the diagnosis bar. When filling out the New Diagnosis Sheet, complete all the necessary fields for the selected diagnosis. If you unsure of which fields to complete, contact your administrator/SYSADMIN.
# Functions

# Save
To save the new diagnosis or edited diagnosis to the database, click save. It will then take the user back to the screen listing all the diagnoses.
# Cancel
This just cancels the new diagnosis and returns the user back to the screen listing all the diagnoses.
Warning
This will not save the diagnosis. If the user clicks cancel instead of ‘Save’ the user will have to re-add that new diagnosis.
Last Updated 3/24/22